How to Insert Table
- Place the cursor on the slide where you want to insert the table
- Click the Insert tab, it will display Tables group on the left
- Click the Table button, it will display four options to insert the table:
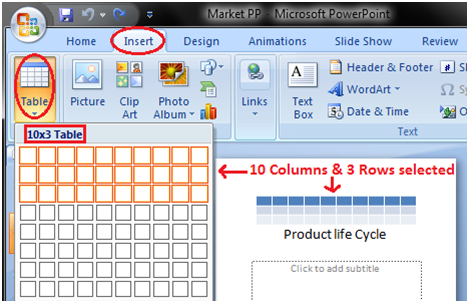
1) Highlight the Number of Rows and Columns
You will see small boxes on top, select the boxes corresponding to number of rows and column that you want in your table.
See the image:
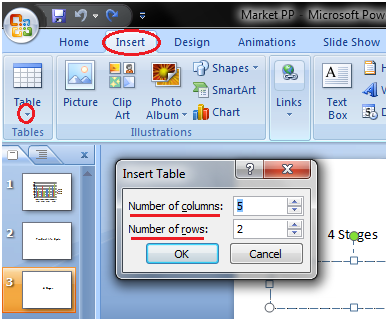
2) Insert Table
Click the Insert Table option and enter the number of rows and columns then click ok.
See the image:
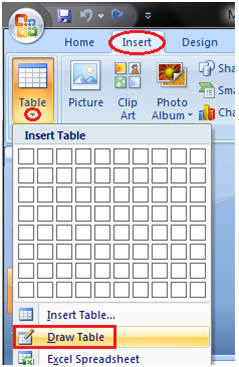
3) Draw Table:
Click the Draw Table option and place the cursor on slide. Cursor changes into a pencil. Click and drag the pencil to draw a table border.
See the image:
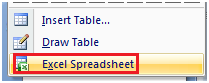
4) Excel Spreadsheet:
Click the Excel Spreadsheet option. Worksheet will appear in the slide, drag it to get the desired number of rows and columns.
See the image:
How to Modify or Format Table
Select the table you want to modify. Two new tabs Design and Layout appear in the Ribbon. These tabs offer various groups of commands to format tables.
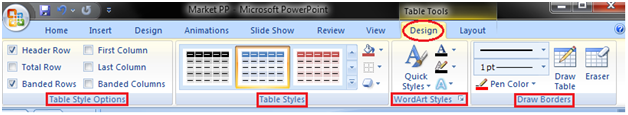
When you click the Design tab it displays you four groups of commands; Table Style Options, Table Styles, WordArt Styles and Draw Borders.
See the Image:
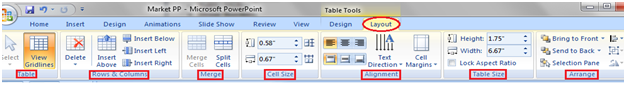
When you click the Layout tab it displays six groups of commands; Table, Rows & Columns, Merge, Cell Size and Alignment.
See the Image:
How to Insert Table from Word or Excel
- Open the desired word document or Excel spreadsheet you want to insert
- Select and copy it
- Then place the cursor on the PowerPoint slide where you want to paste it
- Select Home tab and click the Paste command
How to Insert Chart
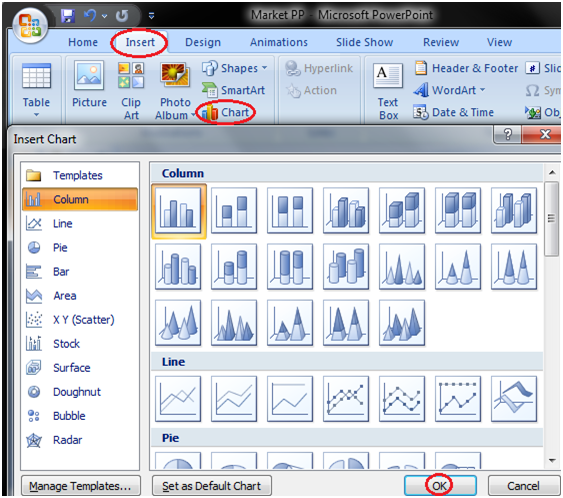
- Select the Insert tab
- In Illustrations group click on Chart command
- An Insert Chart dialogue box appears
- Select the desired Chart style and click Ok
- Chart will be added to slide and an Excel worksheet appears on right side of the slide
See the images:
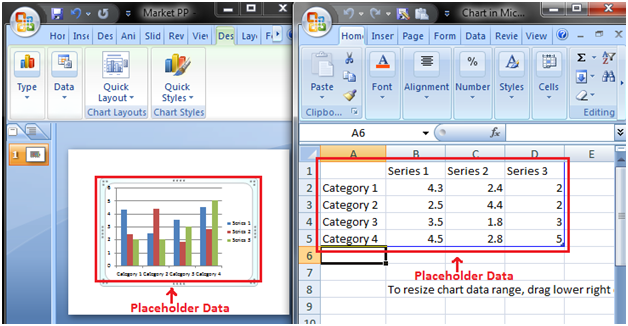
How to Enter Chart Data
We can't enter data directly in charts. To enter data in chart we have to type it in excel spreadsheet that appears when you add Chart or click Edit Chart option.
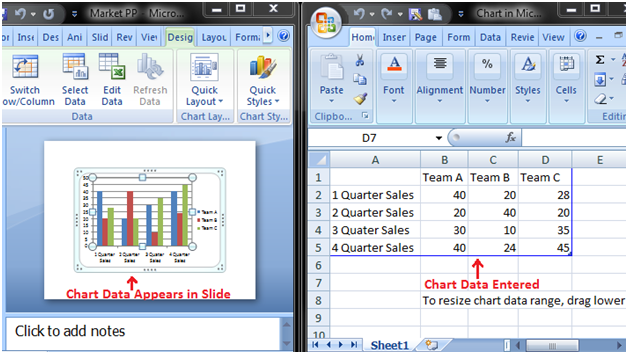
The data that you enter in spreadsheet automatically appears in the Chart. Select the cell of spreadsheet and type the data it will appear in the slide. Repeat the process to enter the entire data.
See the image:
How to Format Chart or Chart Data
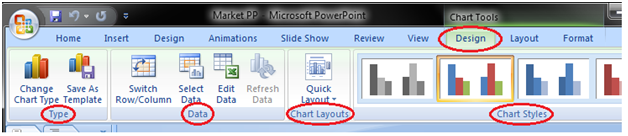
When you select the chart three new tabs Design, Layout and Format appear in the Ribbon. Each tab contains specific groups of chart tools to format charts and chart data.
The Design tab contains four groups; Type, Data, Chart Layouts and Chart Styles.
See the image:
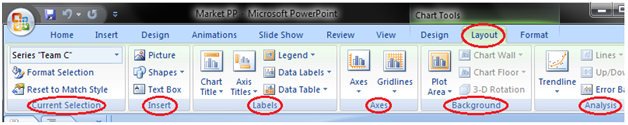
The Layout tab contains six groups; Current Selection, Insert, Labels, Axes, Background and Analysis.
See the image:
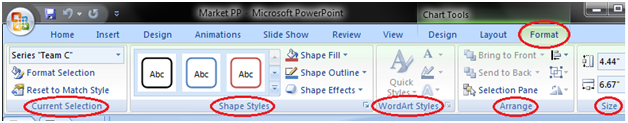
The Format tab contains five groups; Current Selection, Shape Styles, WordArt Styles, Arrange and Size.
See the image: